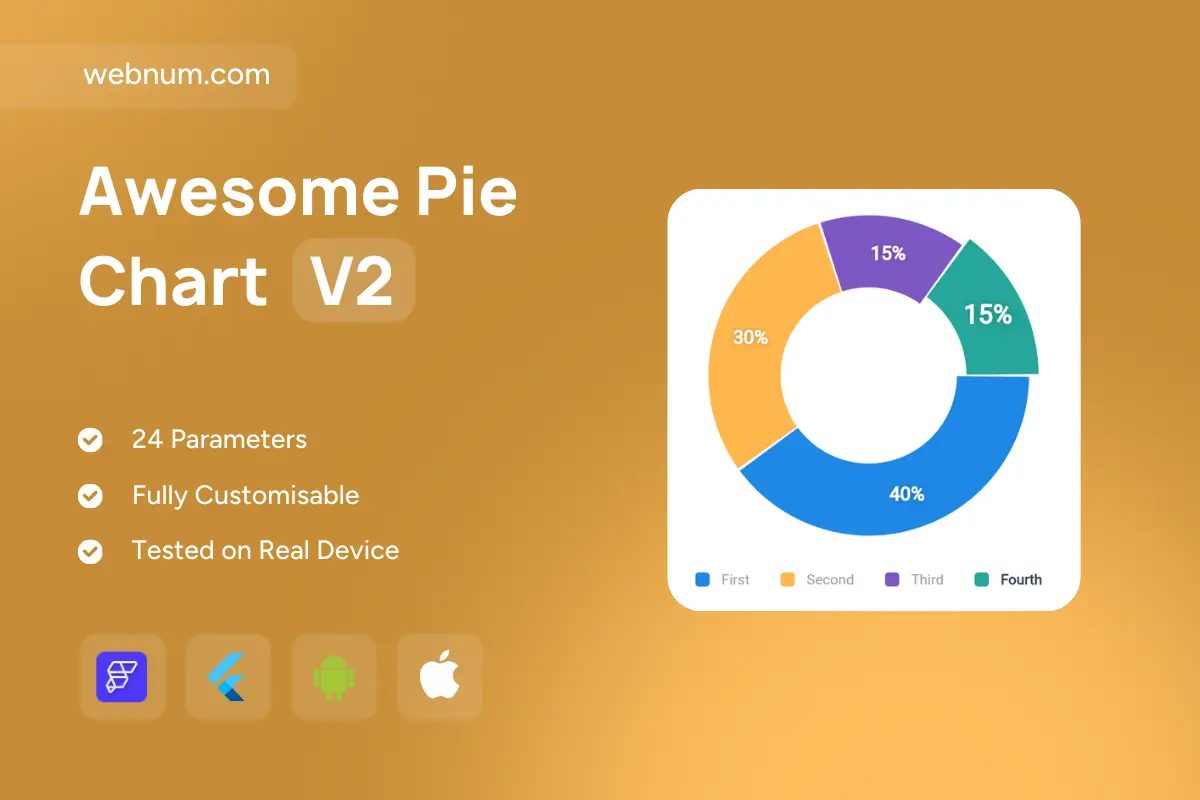
About

A modern ring (donut) chart that visualizes category share with bold percentage labels inside each arc. One slice can be “exploded” (offset) to spotlight a key category while the rest remain in place. Crisp gaps and inner radius improve readability over a classic pie, especially on small screens. The color-coded legend mirrors the slices and supports clear mapping at a glance. Smooth layout scales from cards to full dashboards without aliasing. Ideal for quick distribution summaries in reports, analytics, and product UI.

Functionality

  • Donut/ring rendering with configurable inner radius and slice gap

  • Exploded/offset slice to highlight a category

  • In-arc percentage/value labels with auto contrast

  • Color legend (toggleable) matching slice order

  • Custom start angle, sorting, colors, and rounding

  • Responsive layout; light/dark theme ready; tap/hover callbacks (optional)

Use cases

  • Show category distribution (traffic sources, revenue mix, user segments)

  • Highlight a featured slice in KPI cards or marketing reports

  • Present quick share breakdowns in analytics dashboards

  • Mobile summaries where readable labels are required

Keywords

donut chart, ring chart, pie chart, category distribution, percentage labels, exploded slice, legend, data visualization, dashboard chart, analytics, KPI, responsive chart, interactive chart, mobile chart, Flutter chart, FlutterFlow component, light mode, dark mode.

Awesome Pie Chart V2

We’ll build your app in 7 days
Features
Categories
Style
Support
Single Use Individual License

You may only use this template for one project. For more details, please read the Marketplace Terms of Service.