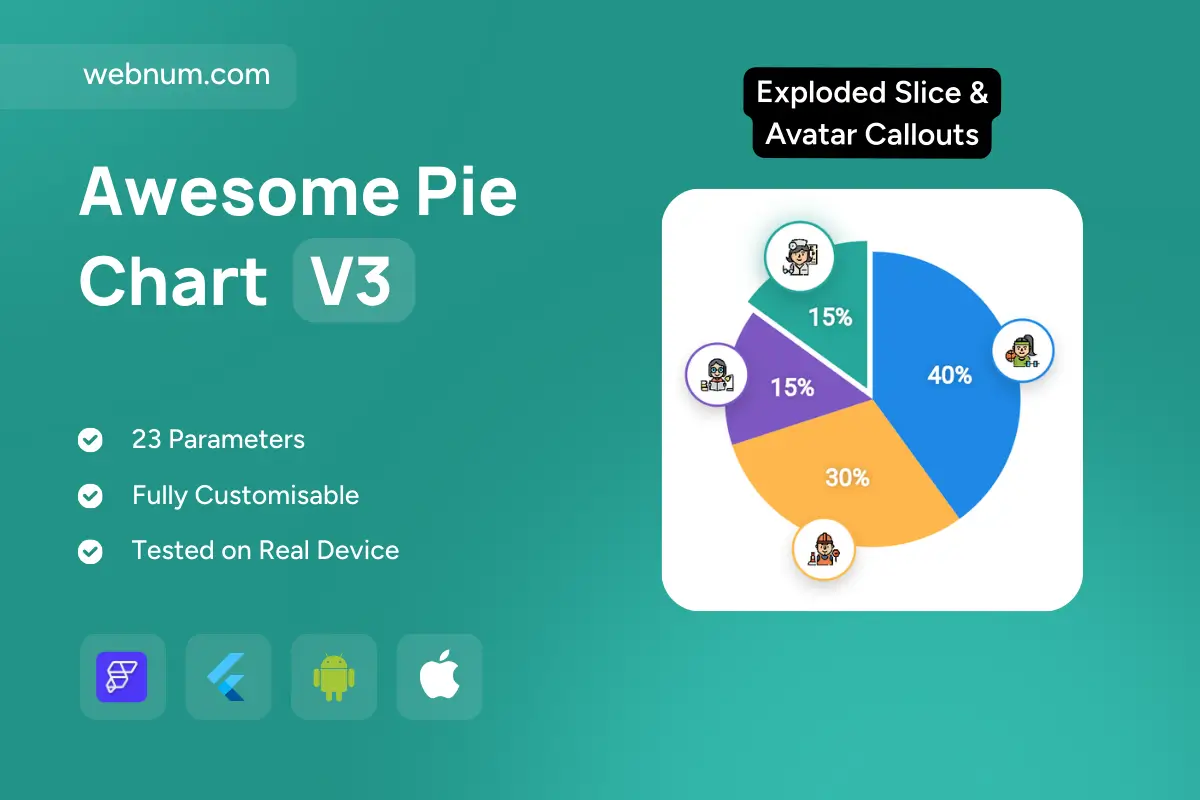
A clean, attention-grabbing badge pie interactive 🍰 chart for instant category insight. Each slice shows a bold % label 💯, while a highlighted exploded slice pops out to spotlight the key segment ✨. Circular avatar/icon callouts 🟢🟣🔵 sit around the pie for legend-free labeling of teams, personas, or product lines. Crisp separators and soft shadows improve readability, and smooth resizing keeps labels clear from compact tiles to full-width reports — perfect for quick distribution insight with a single focal point.
Functionality
💥 Exploded/offset slice highlight with shadow + separator line
🏷️ In-slice percentage labels with auto contrast
🖼️ Avatar/icon callouts per slice (legendless labeling)
🧩 Team/workstream allocation in project dashboards
🛒 Product/category mix for ecommerce & finance
📊 Survey/poll breakdowns for marketing
🔎 KPI cards where one category must be emphasized
Keywords (one line) badge pie interactive, pie chart custom widget flutterflow, exploded slice pie widget, percentage labels pie chart, avatar callouts icon labels, category distribution chart, segment share widget, dashboard pie chart analytics, interactive responsive pie chart, mobile pie chart flutter widget, light dark mode pie chart, custom widget flutterflow charts