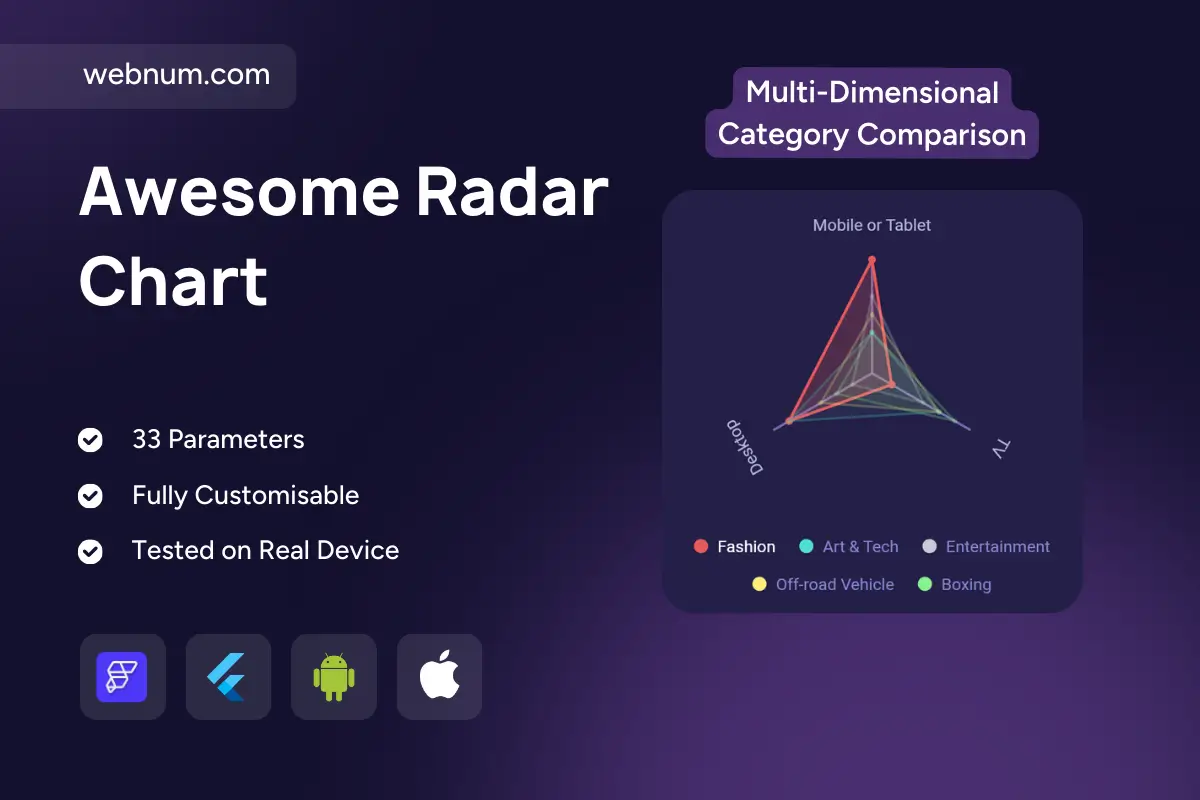
A compact, multi-axis radar chart widget 🕸️ that compares categories across three dimensions — Mobile/Tablet, Desktop, and TV. Each colored polygon represents a dataset (e.g., Fashion, Art & Tech, Entertainment), so strengths, weaknesses, and overlaps are instantly visible. Smooth lines, translucent fills, and clear labels keep patterns readable at a glance — perfect for dashboards and multidimensional insights.
Functionality
🎨 Multiple datasets with distinct colors (Fashion, Art & Tech, Entertainment, Off-road Vehicle, Boxing)
📐 Three-axis structure: Mobile/Tablet • Desktop • TV
🧩 Smooth polygon rendering with optional area fill
🪞 Overlapping transparency for multi-category visibility
🏷️ Tooltip/hover highlight for precise values
📱 Fully responsive layout for mobile & web dashboards
Use cases
📊 Compare user engagement across devices for various industries
📝 Visualize survey results and categorical ratings across dimensions
🧭 Show product/feature performance across usage channels
🛍️ Market analysis: reveal consumer preferences by platform
🎓 Fitness/education/entertainment apps with multidimensional scoring