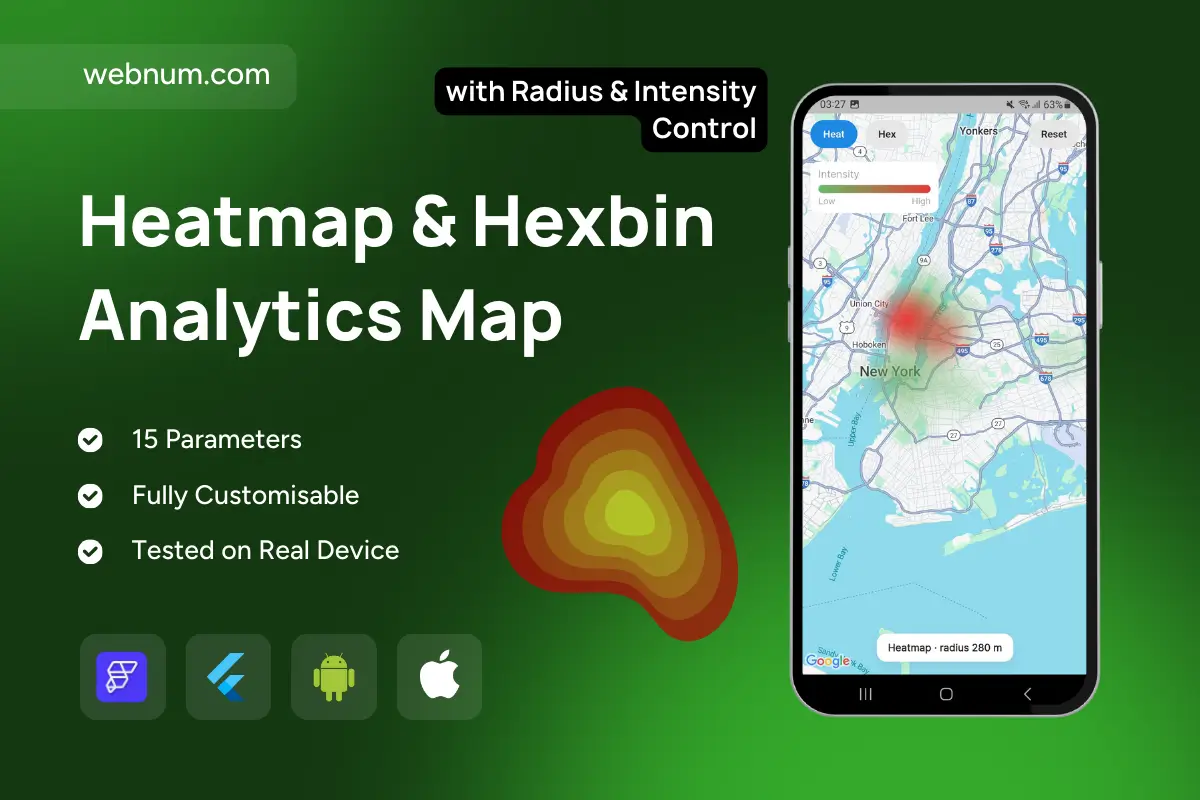
An interactive map component that visualizes point data as a smooth heatmap or hexbin grid. Users can switch modes on the fly, tune radius/step and intensity, and quickly reset the view to explore spatial patterns and hotspots.
Functionality
-
Two visual modes: toggle between Heatmap (gradient density) and Hexbins (aggregated cells).
-
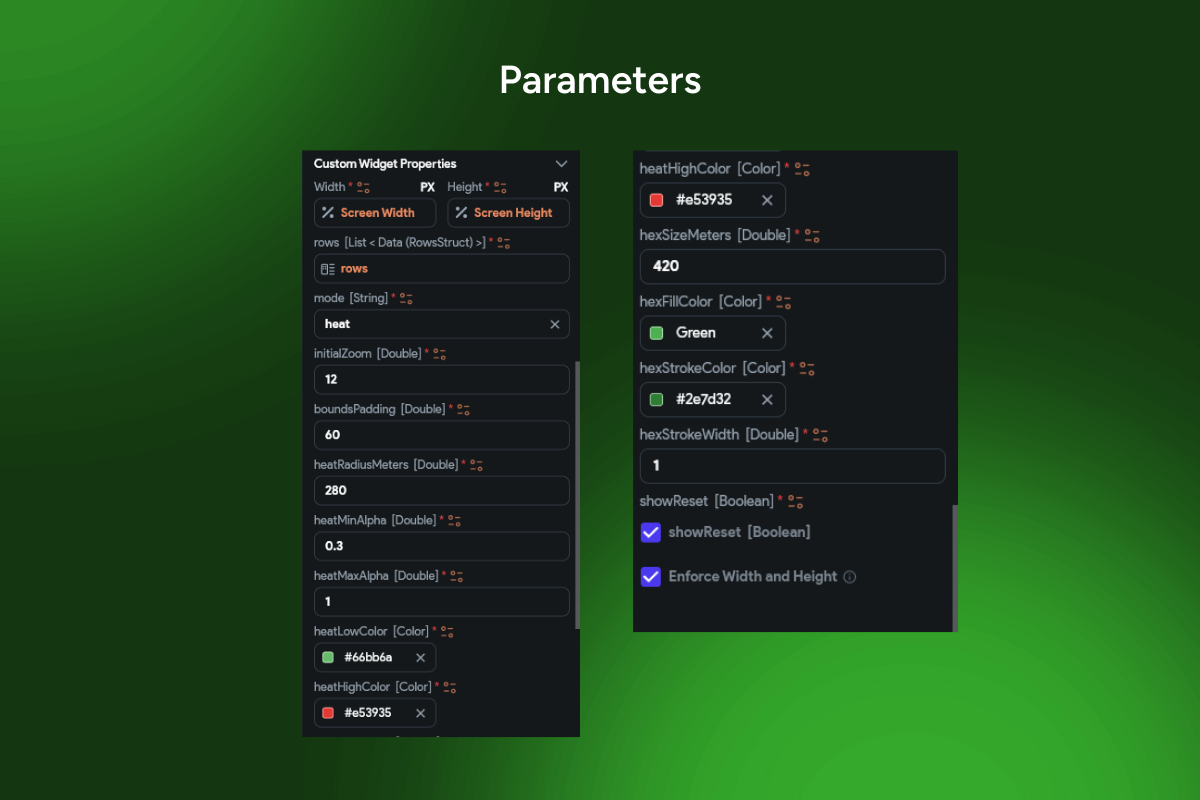
Adjustable parameters: live control of radius (heatmap) and step/size (hexbin).
-
Intensity scale & legend: visualize low→high values; updates as you pan/zoom.
-
Weighted points support: render counts or custom weights (e.g., traffic, sales, incidents).
-
Per-cell stats (hex): show count and average weight in the selected hex.
-
In-reach counter: display how many points fall inside the current area.
-
Responsive & performant: handles large datasets with progressive rendering.
-
Reset & fit actions: one tap to clear styling and refocus the map.
-
Card actions (optional): open detail sheets with image, address, and quick actions (route/share).
-
Works with Google Maps (Flutter/FlutterFlow ready).
Use cases
-
Footfall & demand analysis for retail, events, and mobility.
-
Incident & safety mapping (complaints, accidents, outages).
-
Delivery & logistics coverage—find service gaps and optimize regions.
-
Real estate search—price density or listing concentration by neighborhood.
-
Marketing & geo-campaigns—visualize conversions/leads by area.
-
Smart city / IoT—sensor readings and environmental metrics.
-
Operations dashboards—support capacity planning and resource allocation.
-
Tourism & venues—identify hotspots and crowding times.
Keywords
Heatmap overlay, Hexbin aggregation, Density visualization, Weighted points, Radius slider, Intensity control, Step size, Spatial analytics, Google Maps, Flutter, FlutterFlow, Mobile map UI, Hotspots, Geospatial dashboard.
Heatmap & Hexbin Analytics Map
- Fixed price & scope
- Pixel-perfect UI/UX
- App Store & Google Play submission
You may only use this template for one project. For more details, please read the Marketplace Terms of Service.