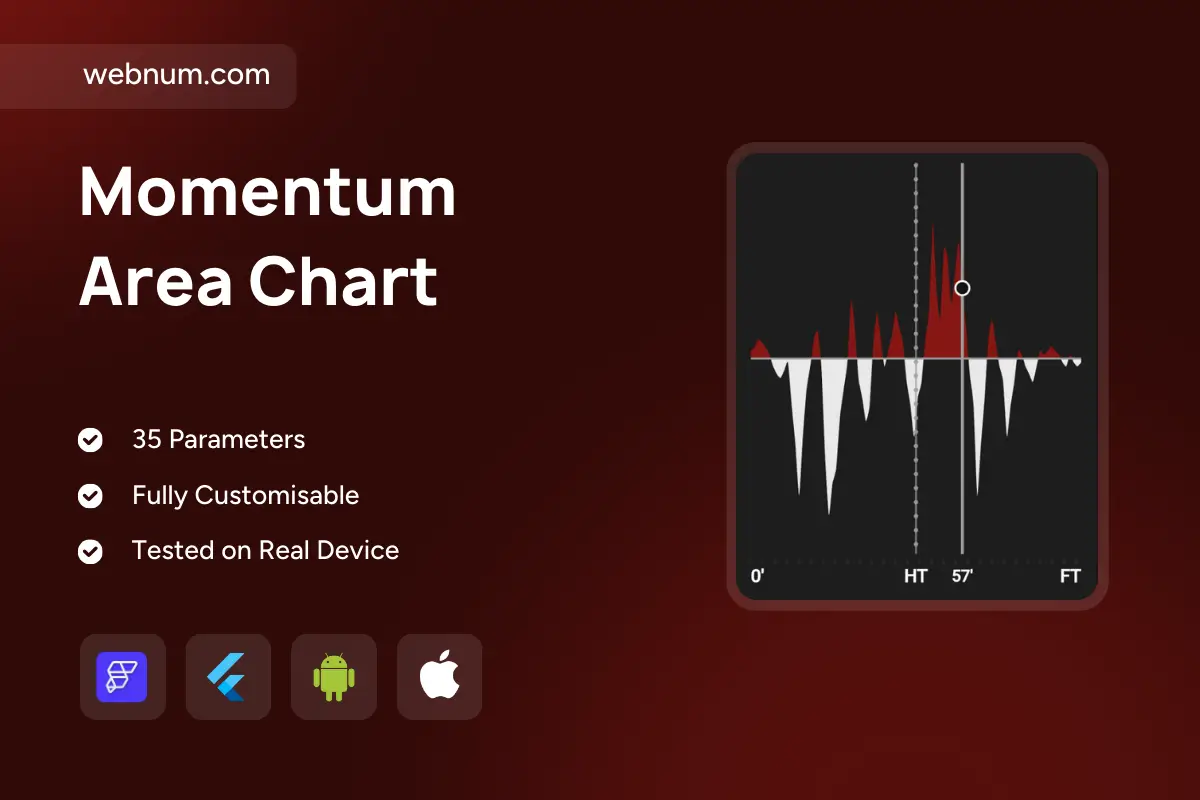
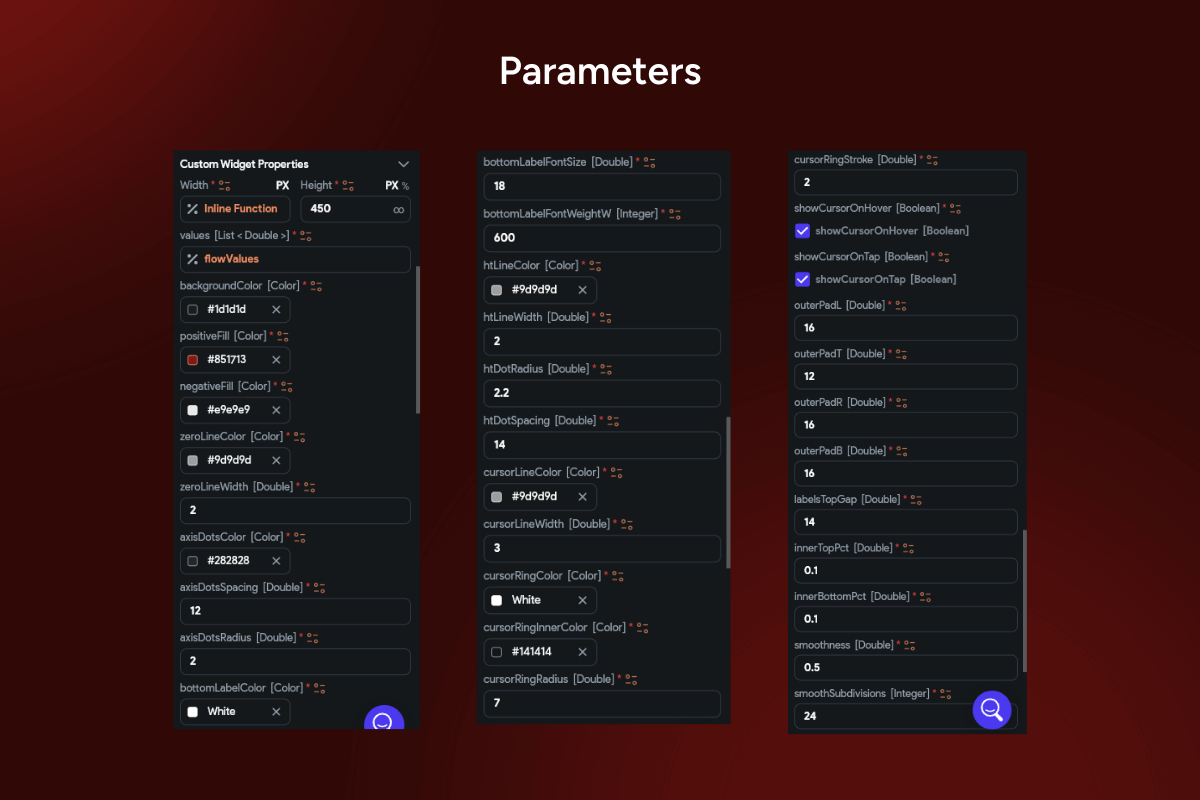
Visualize swings at a glance with a momentum chart widget 📈⚖️ — a dual-area graph that uses a zero baseline to show positive performance in red 🔺 and negative dips in white 🔻. It highlights fluctuations, intensity, and turning points, making it perfect for competitive performance, win/loss balance, and trend reversals. Vertical markers (HT, 57’, FT) ⏱️ add instant context for time-based events.
Functionality ⚙️
➕➖ Dual-area visualization above/below the zero baseline
🔺🔻 Positive (red) vs. negative (white) momentum highlighting
🗓️ Dynamic vertical markers for half-time, milestones, or custom events
🧭 Tooltip at any timestamp for precise values
📐 Responsive grid for accurate reading of shifts
🖱️ Interactive hover to emphasize key changes and inflection points
Use cases 💡
🏟️ Sports analytics: track team dominance over match time
💹 Finance dashboards: profit/loss momentum and reversals
👥 Customer analytics: engagement vs. churn signals
🛠️ Ops monitoring: above/below KPI thresholds
🗳️ Polling shifts: positive vs. negative swings over time
Keywords (one line, lowercase) 🔑
momentum chart widget, flutterflow momentum chart custom widget, custom momentum area chart widget flutterflow, positive negative area chart flutterflow widget, zero baseline analytics chart widget flutterflow, sports momentum chart flutterflow component, win loss trend graph custom widget, event markers ht ft timeline chart flutterflow, tooltip interactive area chart flutterflow, responsive data visualization widget flutterflow, performance fluctuations kpi tracking widget flutterflow, financial momentum area chart flutterflow, trend reversal analytics chart custom widget