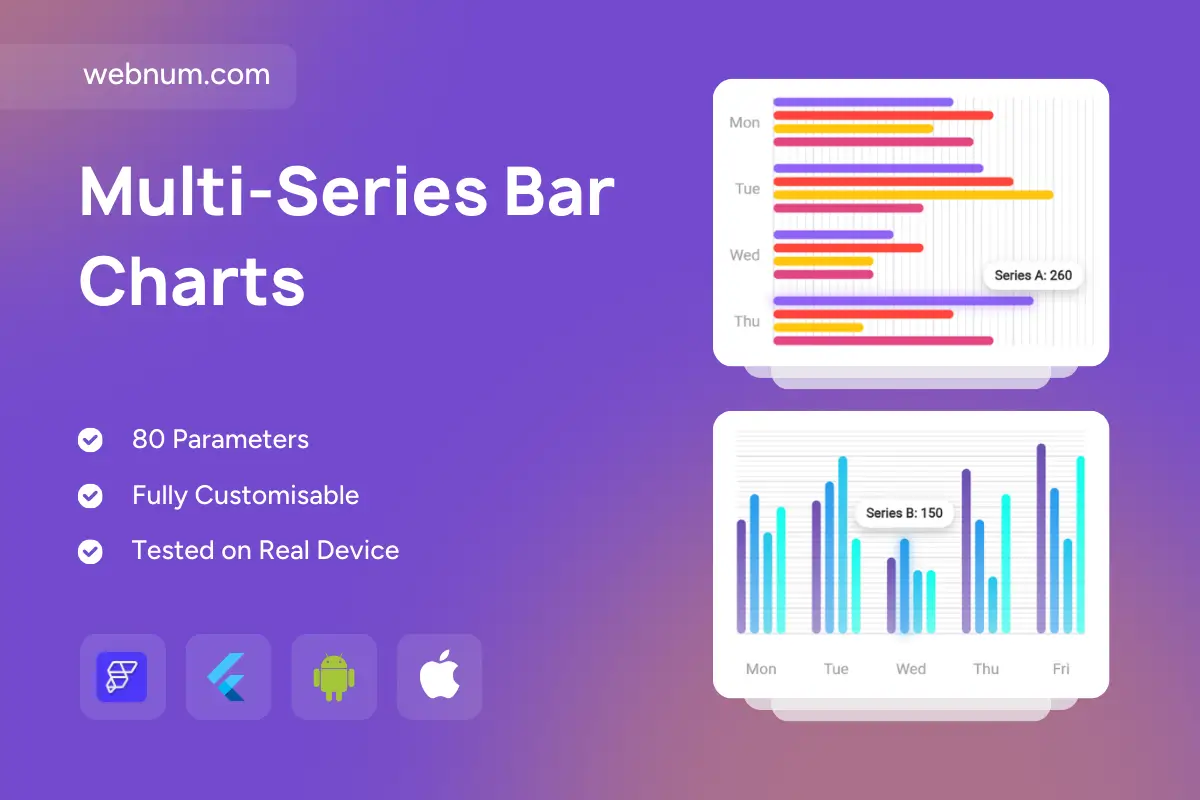
About

A dual chart component combining horizontal bar charts and vertical bar charts for advanced comparative analytics. The top chart displays horizontally stacked series across weekdays, making it ideal for ranking and distribution analysis. The bottom chart showcases vertically aligned series for trend visibility across the same categories. Together, they provide a complete visualization system for multidimensional data, offering both ranking clarity and temporal insights in one view.


Functionality

  • Horizontal Bar Chart (top): Multi-series layout with weekday categories, highlighting distribution and series totals with tooltips.

  • Vertical Bar Chart (bottom): Parallel multi-series columns, great for visualizing volume fluctuations and trend peaks across time.

  • Interactive Tooltips: Hover reveals exact values for each series.

  • Scrollable Layout: Handles large datasets with smooth navigation.

  • Color-Coded Series: Each dataset is distinguished with unique colors for easy comparison.

  • Responsive Design: Scales across mobile, tablet, and desktop dashboards.


Use cases

  • Comparing weekly workload distribution across multiple teams or departments.

  • Visualizing sales or revenue split by category (horizontal) and tracking daily totals (vertical).

  • Education dashboards for showing test scores per subject vs. student progress over time.

  • Marketplace insights for product performance ranking alongside trend tracking.

  • Operational reporting where ranking and trend data must be interpreted together.


Keywords

horizontal bar chart, vertical bar chart, multi-series chart, dual chart visualization, stacked bars, comparative analysis, weekly distribution, sales performance, workload analysis, KPI dashboard, data visualization, analytics widget, interactive chart, tooltips, scrollable chart, responsive design, FlutterFlow chart, Flutter widget, mobile analytics, desktop analytics, time series, category comparison, ranking chart, visual trends, performance tracking, data insights, product analytics, dashboard visualization, business intelligence, modern UI component.

Multi-Series Bar Charts

We’ll build your app in 7 days
Features
Categories
Style
Support
Single Use Individual License

You may only use this template for one project. For more details, please read the Marketplace Terms of Service.