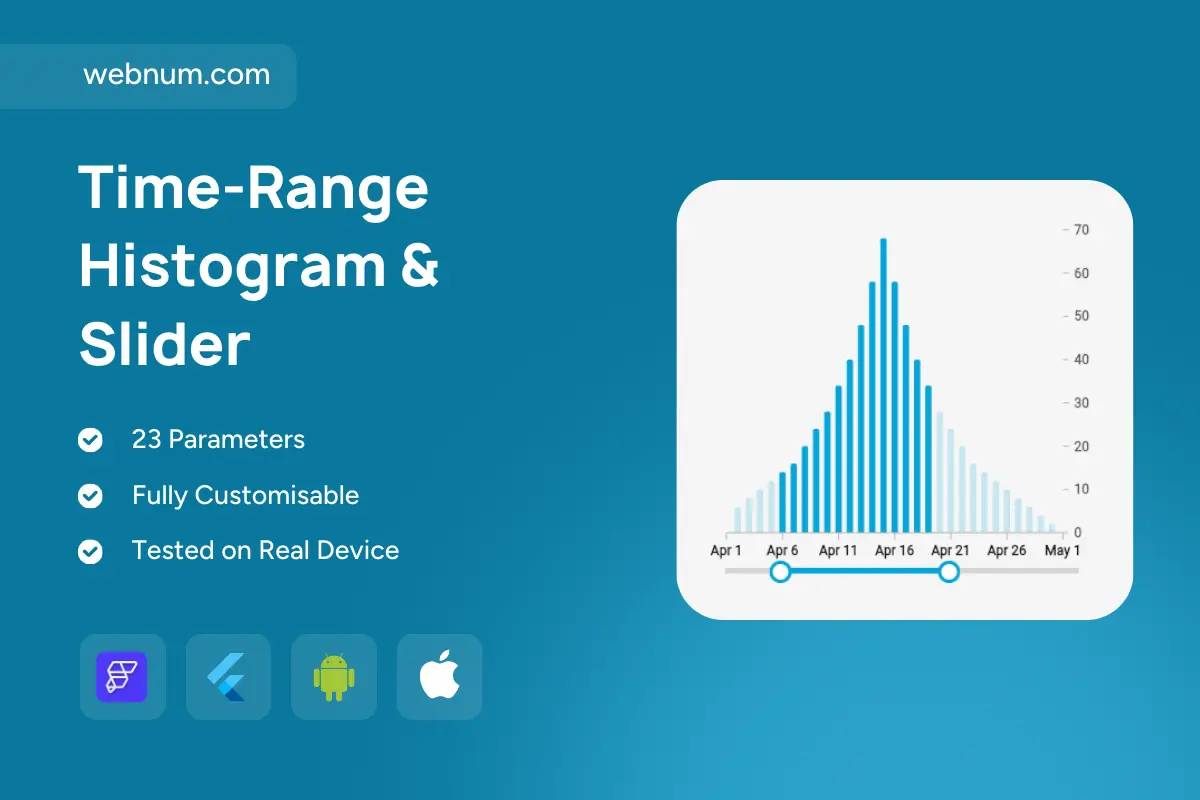
📊 An interactive histogram range slider widget with a dual-handle brush underneath. Drag the brush to pick a window; in-range bars pop while the rest fade — instant focus on trends, peaks, and seasonality. Perfect for analytics dashboards and date-based filters. ⚡
⚙️ Functionality
-
📅 Flexible bins: per-day or weekly with configurable bucket size & rounding
-
🎚️ Brush selector: dual handles, drag to pan, optional snap-to-ticks
-
🔄 Live callbacks: update lists, KPIs, or maps outside the chart in real time
-
🧭 Hover tooltips with date + value; optional crosshair
-
📐 Auto Y-axis rescale based on the selected window (toggleable)
-
🔍 Zoom to selection / Reset actions + keyboard nudge support
-
🎨 Styled bars: rounded caps, gradients, and out-of-range dimming
-
🧱 Axes & gridlines: localized date labels, custom tick density
-
💤 States: empty/error/loading with skeleton placeholders
-
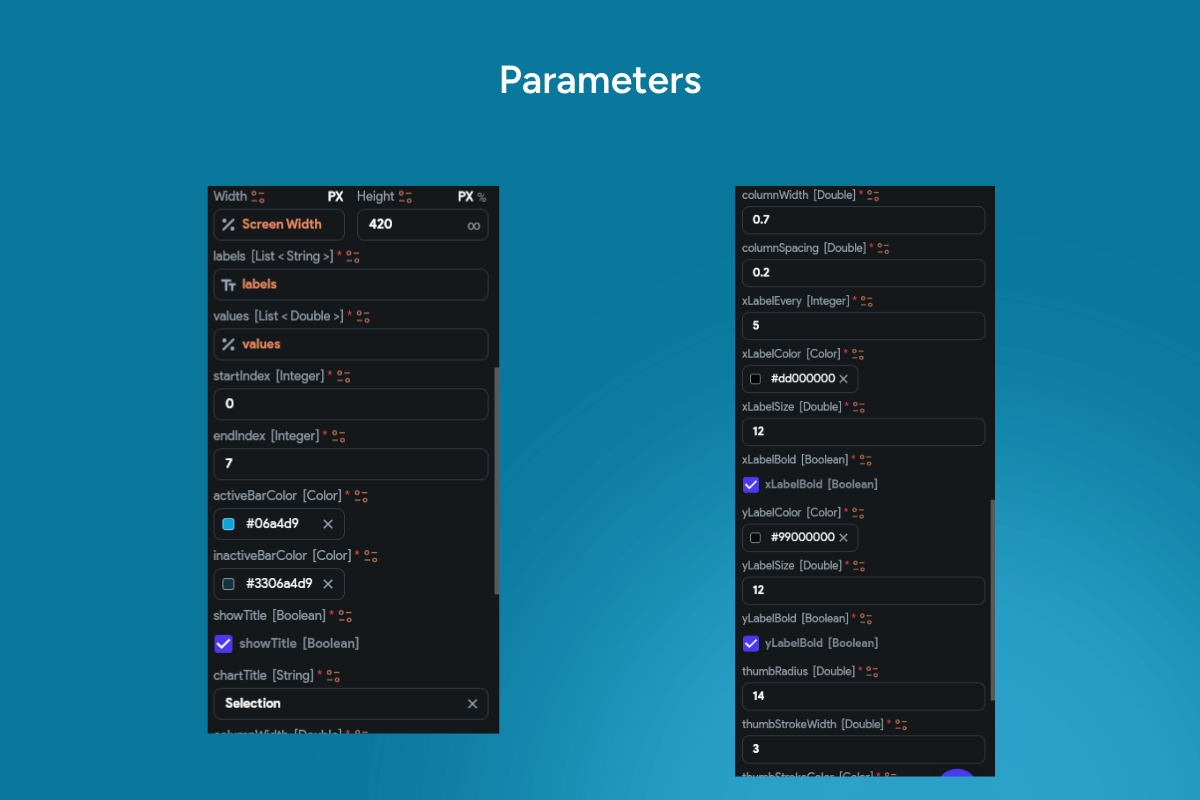
🧩 Themeable: colors, fonts, grid, bar radius; Light/Dark ready
-
🔌 Data binding: Firestore / Supabase / REST / CSV, streaming updates
-
🚀 Performance: virtualized rendering + GPU-accelerated animation
-
♿ Accessibility: high-contrast palette, ARIA labels, screen-reader values
Great for: 📈 analytics dashboards • 🗓️ date filters • 🔔 event timelines • 🌦️ seasonality & trend exploration.
Keywords: histogram, date histogram, time series chart, brush, range slider, dual handle, time window, bar chart, buckets, bin width, aggregation, zoom, pan, autoscale, tooltips, hover, crosshair, gridlines, interactive chart, analytics dashboard, data filter, seasonality, peaks, trends, counts, events timeline, FlutterFlow chart, Flutter widget, responsive visualization, dark mode, light mode, Firestore binding, Supabase integration, REST API, CSV data, performance, accessibility, rounded bars, gradient fill, KPI update, real-time updates.