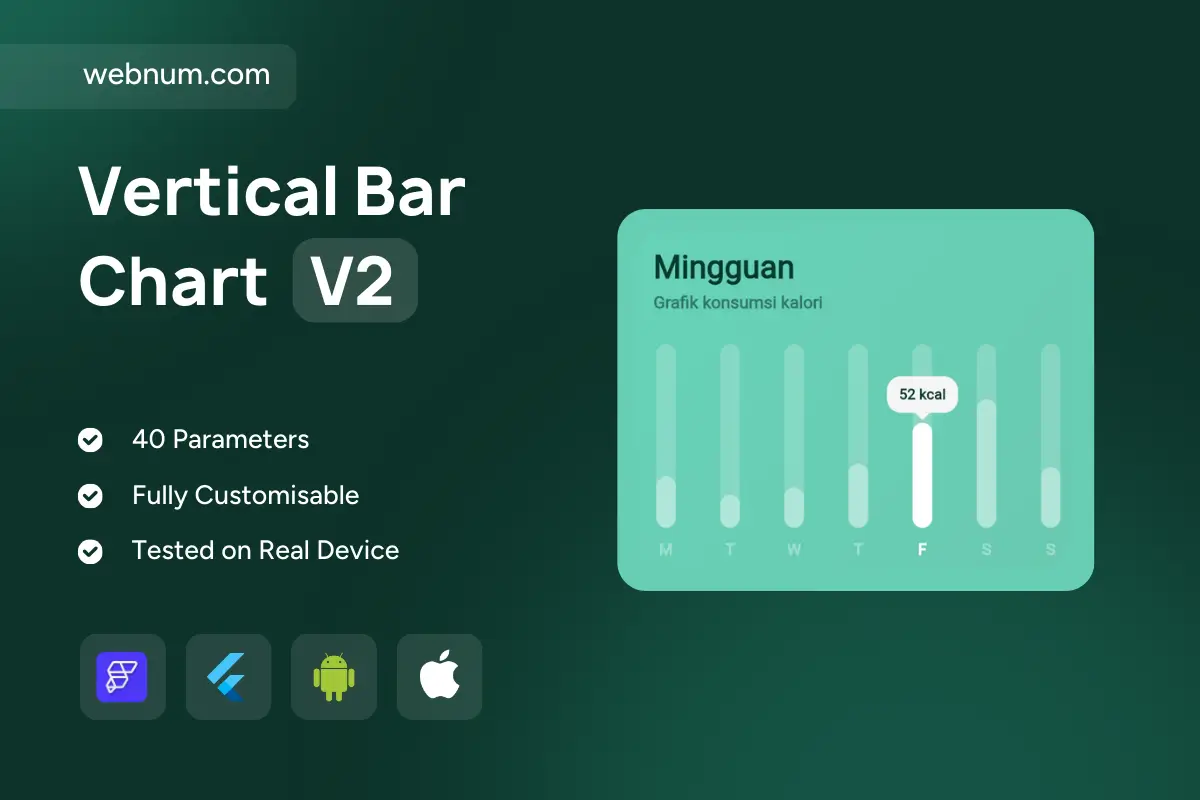
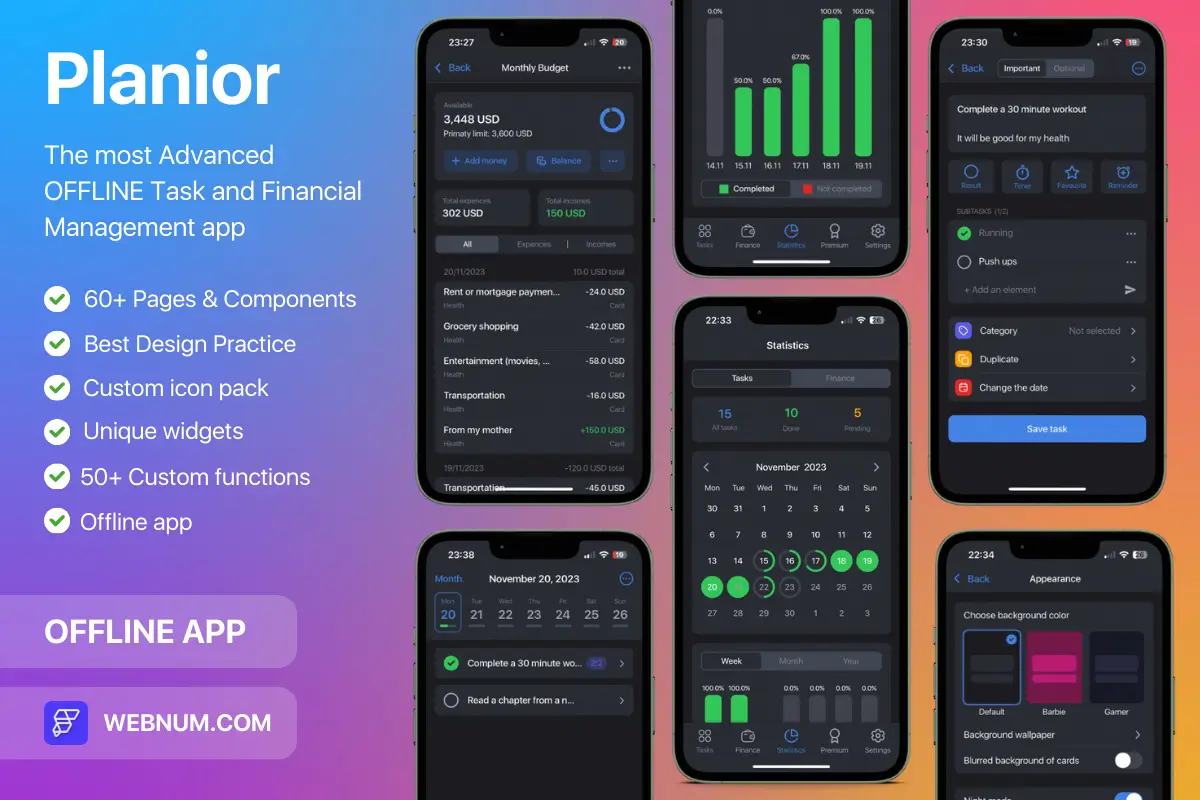
A clean, minimal capsule bar chart widget 📊 for showing values across categories (days, weeks, custom labels). Pill-shaped bars fill dynamically to reveal performance and progress over time 🔄. An active value pops with a tooltip bubble 🏷️ for instant insight. Smooth animations ✨, rounded design 🟩, and a lightweight build keep dashboards and mobile apps fast and beautiful. Fully themeable to match any light/dark UI 🎨.
Functionality
🟦 Single-series capsule (pill) vertical bars with dynamic fill
🏷️ Tooltip bubble on tap/hover showing the exact value
🗓️ Custom category labels (days, months, or any text)
🟢 Rounded corners, modern styling, gradient/solid fills
📈 Trend snapshots in dashboards and overview cards
🛒 Compare sales/tasks/goals across categories
🔍 Highlight peaks and dips in performance
📱 Mobile-friendly stats for SaaS/admin panels
Keywords (one line) capsule bar chart widget, capsule bar chart custom widget flutterflow, pill bar chart widget flutterflow, vertical bar chart flutterflow, single series bar graph flutterflow, rounded bars gradient chart, tooltip value bar chart, responsive mobile chart widget, animated bar chart flutterflow, kpi dashboard widget, lightweight bar chart component, data visualization widget flutterflow, modern chart ui, dark mode bar chart, custom widget flutterflow charts