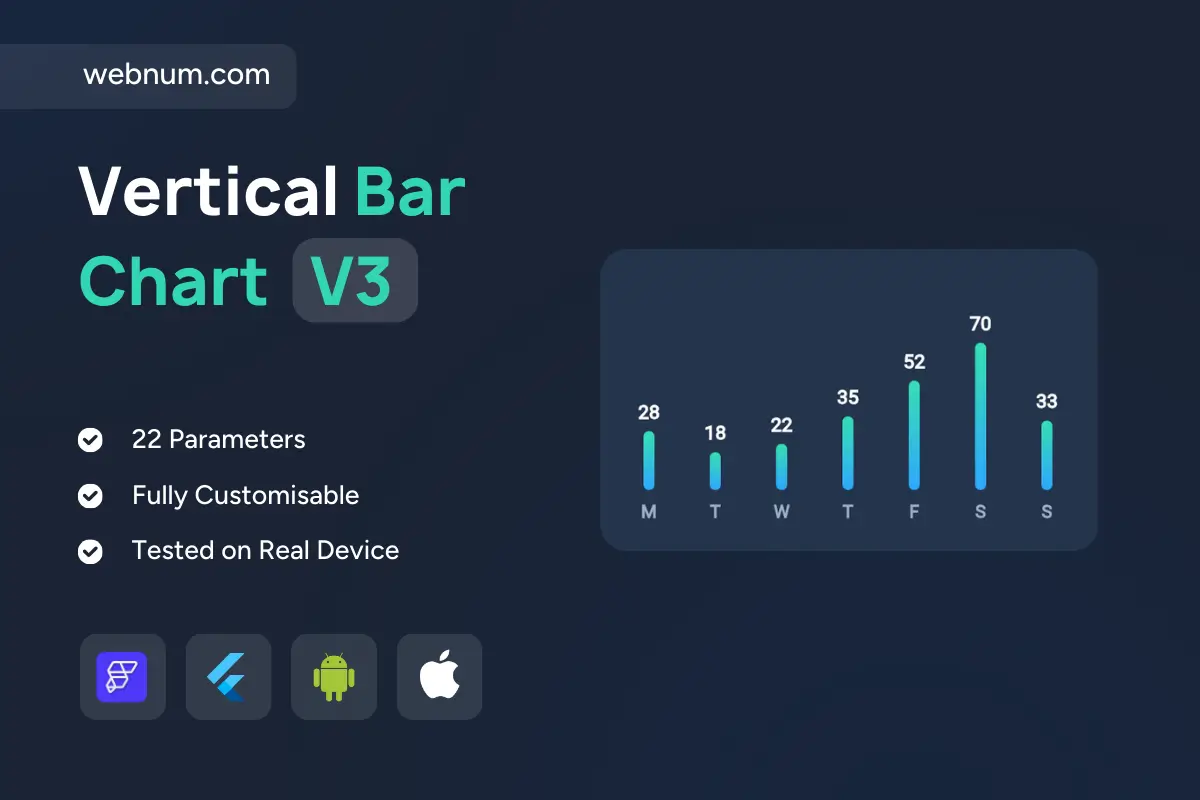
A compact, touch-friendly gradient bar chart widget 📊 for showing one metric across categories (days, weeks, items). Gradient-filled columns with rounded caps 🌈 keep values legible on dark or light backgrounds, while crisp labels sit above each bar for instant reading 🏷️. Even spacing and short X-axis tags (M, T, W…) make scanning fast ⏱️. Values animate in from the baseline ✨ to highlight change and trend. Fully themeable and lightweight — drops into lists, cards, and overview screens without fuss.
Functionality
🟦 Single-series vertical bars with rounded caps and gradients
🏷️ Auto-formatted value labels rendered above each bar
Keywords (one line) gradient bar chart widget, vertical bar chart custom widget flutterflow, single series bar graph flutterflow, rounded gradient bars, value labels bar chart, animated bar chart widget, weekly category chart, responsive dashboard chart, dark mode chart widget, mobile analytics chart, kpi bar chart flutterflow, simple bar chart custom widget, data visualization flutterflow