

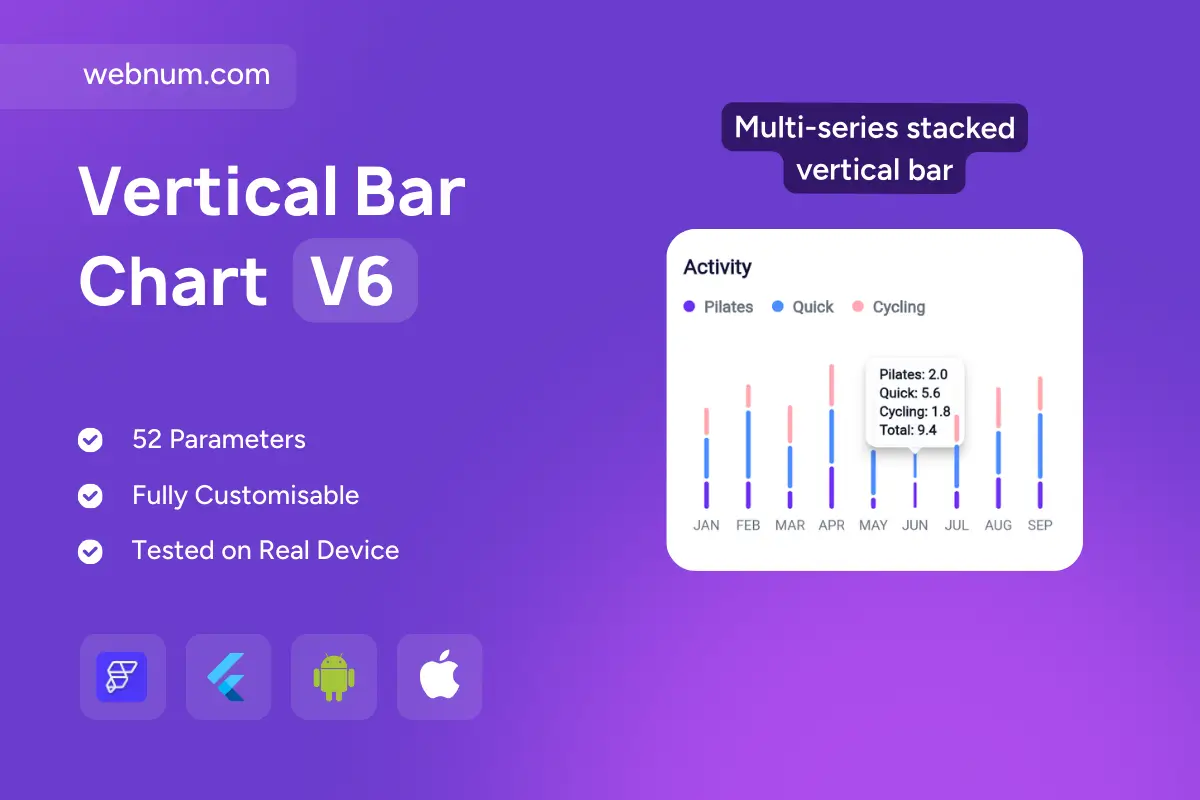
A modern vertical bar chart widget 📊 built for visualizing multi-category activity over time. Each bar is stacked with distinct colors (e.g., Pilates, Quick, Cycling) 🟣🔵🟡 to show both individual values and the total at a glance. Hover/tap tooltips 🏷️ reveal exact breakdowns + totals, making comparisons intuitive. Monthly grouping supports trend analysis 📅 while keeping the layout clean, minimal, and dashboard-ready. Ideal for tracking performance, resources, or multi-category metrics in a single view.
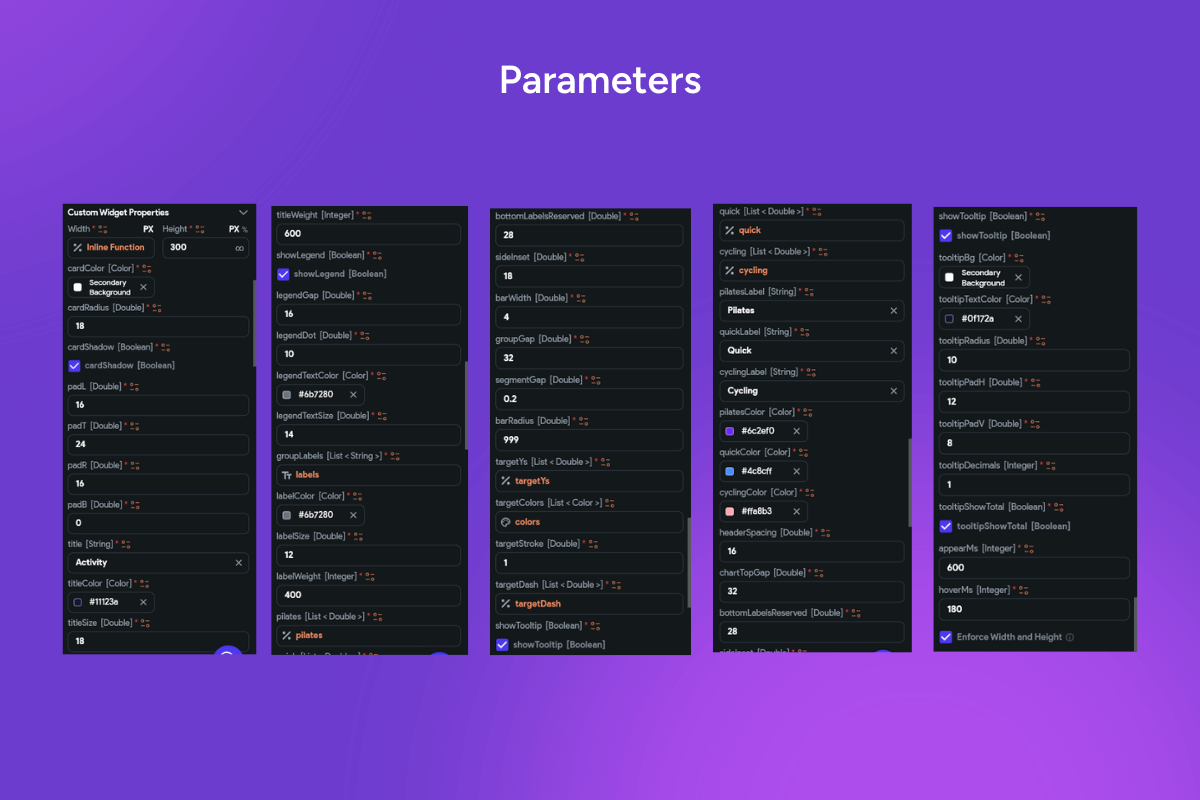
Functionality
-
🟦 Multi-series stacked vertical bars with distinct colors
-
🏷️ Category breakdown tooltips (e.g., Pilates, Quick, Cycling) + auto totals
-
📅 Monthly grouping for clear trend comparison
-
🎨 Legend with category labels & synced colors
-
🖱️ Hover/tap highlights & data focus states
-
📱 Fully responsive for dashboards, mobile, and web apps
Use cases
-
🏃 Fitness or activity tracking across months
-
💼 Performance metrics vs targets over time
-
🛒 Sales or task breakdown by category
-
🧾 Resource allocation across teams/departments
-
📊 Business, health, education & finance dashboards
-
🧠 Data storytelling with totals and category impact
Keywords (one line)
vertical bar chart widget, stacked bar chart custom widget flutterflow, multi-series bar chart flutterflow, activity tracker bar chart widget, monthly trend chart flutterflow, tooltip breakdown bar chart, performance chart widget flutterflow, resource allocation chart, kpi dashboard bar widget, responsive bar chart custom widget, data visualization flutterflow, interactive reporting chart, clean chart design flutterflow, business analytics chart widget, multi-category chart flutterflow
Vertical Bar Chart V6
- Fixed price & scope
- Pixel-perfect UI/UX
- App Store & Google Play submission
You may only use this template for one project. For more details, please read the Marketplace Terms of Service.