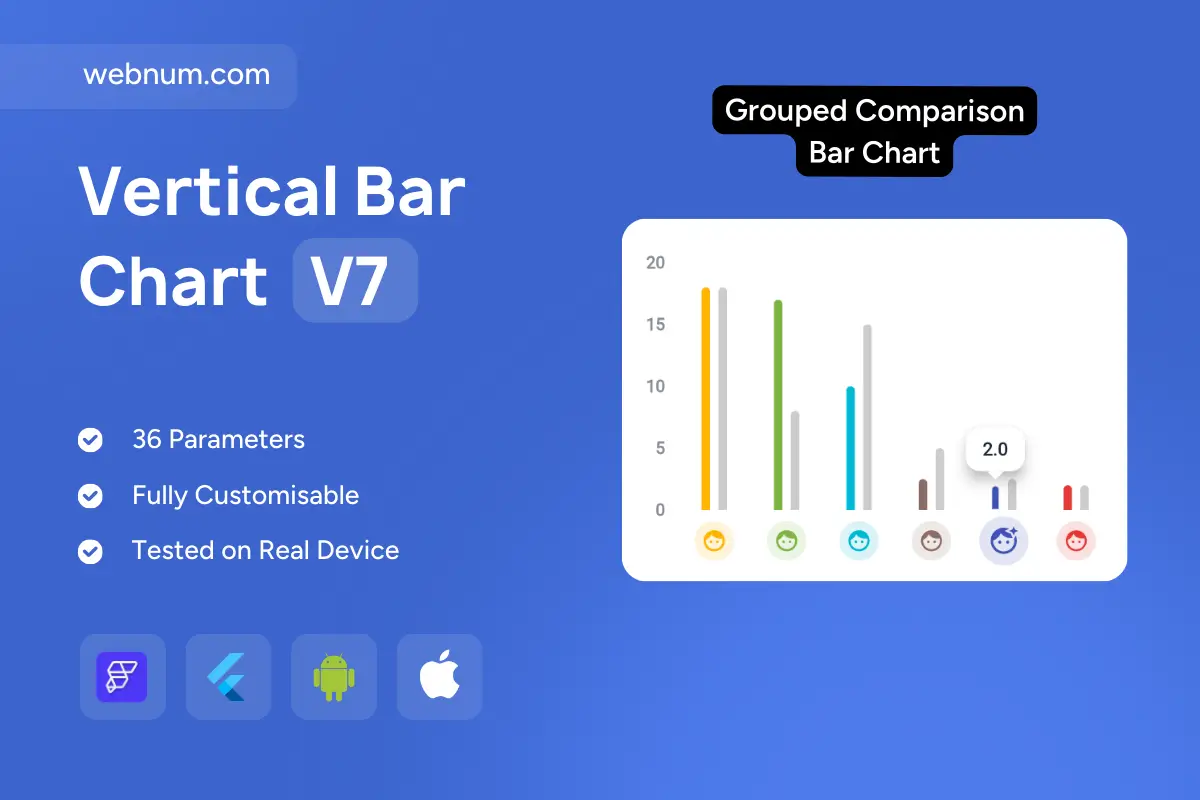
A playful yet clear interactive vertical bar chart 📊 for side-by-side comparisons across categories. Each group uses a circular emoji/ icon label 😀 to keep things approachable, with 1–2 bars (actual vs benchmark/target) for instant contrast. A tidy Y-axis, rounded caps, and soft shadows focus attention on values, while tap/hover tooltips 🏷️ reveal exact numbers. Works with integers or decimals, adapts to light/dark themes, and scales smoothly from mobile to desktop dashboards.
Functionality
👯 Grouped vertical bars: 1–2 series per category (actual vs target/benchmark)
😀 Emoji/icon category labels with colored accents
🏷️ Value tooltips on tap/hover (exact number)
📏 Configurable scales, min/max, and tick density
🧭 Optional gridlines, rounded bar caps, and shadows
📱 Responsive layout (mobile/tablet/desktop) with themeable colors & typography
Use cases
🎯 Compare actual vs target KPIs by category
🧪 Education apps: quiz scores by topic
💪 Health/fitness: planned vs completed metrics
🛒 Retail dashboards: category performance vs forecast
🧑💼 HR/productivity: team output vs goal across departments
Keywords (one line) interactive vertical bar chart, vertical bar chart custom widget flutterflow, grouped bar chart widget flutterflow, comparison bar chart custom widget, target vs actual bar chart flutterflow, benchmark bar chart widget, emoji labels bar chart widget, tooltip values bar chart flutterflow, responsive bar chart custom widget, interactive chart widget flutterflow, dashboard visualization bar chart, kpi bar chart flutterflow, mobile web bar chart widget, light dark theme chart, business analytics bar chart, custom widget flutterflow charts, flutter chart widget, category bar chart flutterflow, side by side bar chart widget