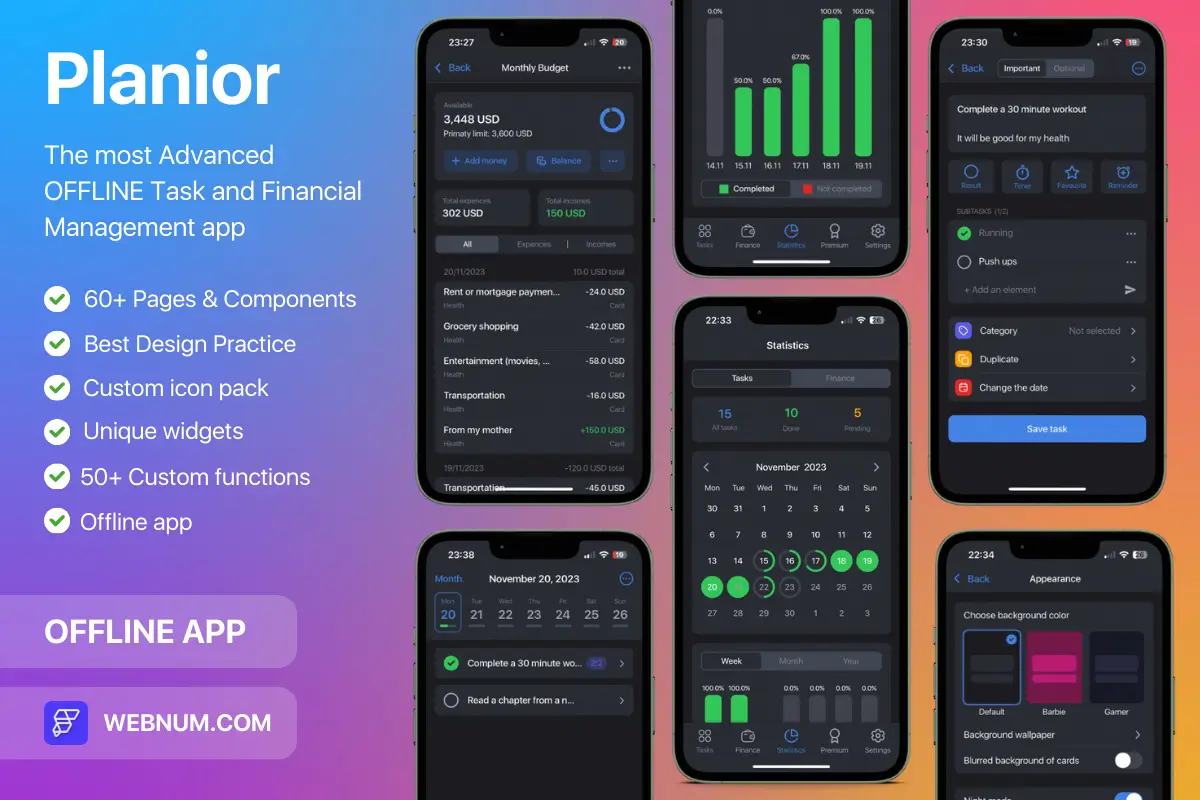
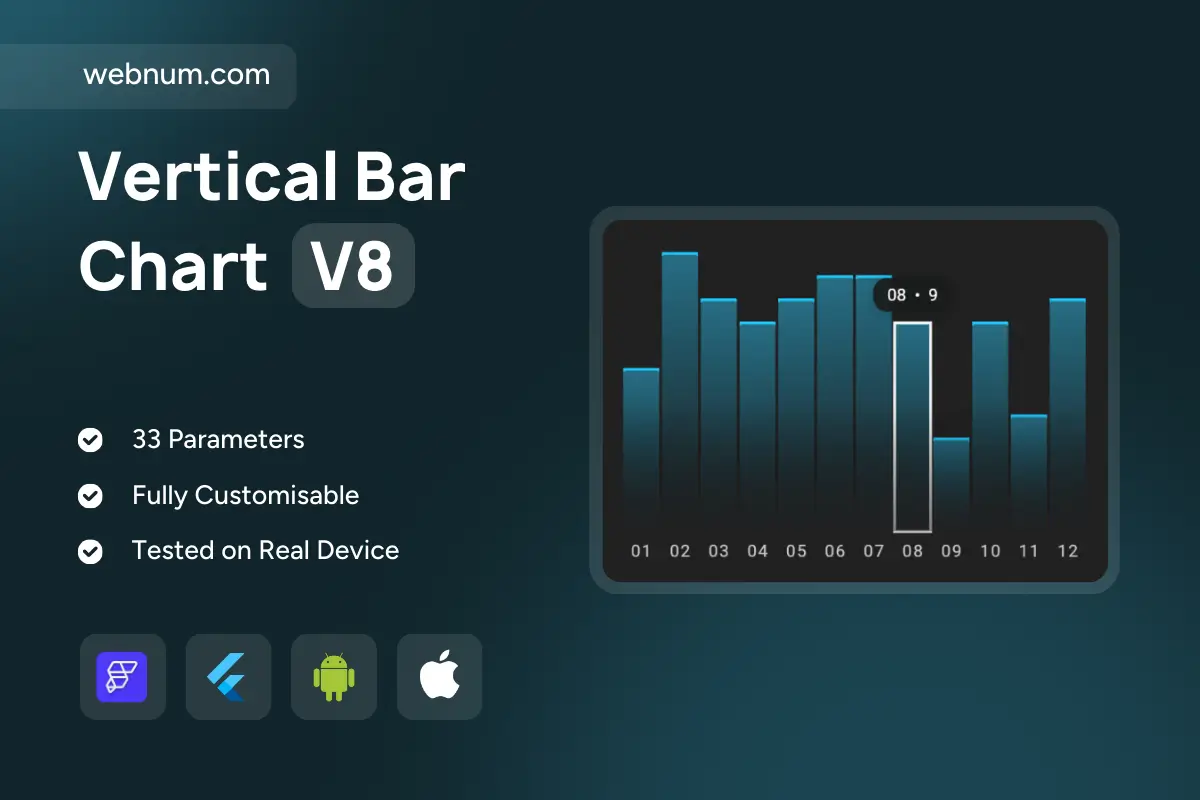
Visualize categorical data with a vertical bar chart widget 📊 — perfect for side-by-side comparisons across sequential categories. Each bar maps a value to its category for instant highs/lows insight, while hover tooltips 🧭 reveal exact numbers. A subtle gradient fill 🎨 adds depth, and a highlighted bar ✨ helps you focus on a single data point. Ideal for KPI dashboards, reports, and quick business insights.
Functionality ⚙️
-
🟦 Vertical bars with smooth gradient styling
-
🧭 Hover tooltips showing exact category + value
-
✨ Highlighted/active bar with border emphasis
-
📐 Grid lines + Y-axis labels for readability
-
🧩 Aligned categories on the X-axis
-
📱 Responsive resizing for mobile, tablet, and desktop
Use cases 💡
-
📈 Monthly sales with category breakdowns
-
👤 User activity by day/week
-
💰 Revenue/expense category comparisons
-
📊 KPI dashboards and performance overviews
-
📝 Survey/poll analytics with multiple-choice results
-
⚡ Quick visualization of structured categorical datasets
Keywords (one line, lowercase) 🔑
vertical bar chart widget, flutterflow custom bar chart widget, custom bar chart widget flutterflow, column chart flutterflow widget, categorical data visualization widget flutterflow, kpi dashboard chart widget flutterflow, reporting chart custom widget flutterflow, gradient bars chart widget flutterflow, hover tooltip bar chart flutterflow, highlighted bar state widget flutterflow, responsive chart widget flutterflow, mobile analytics chart flutterflow, web dashboard chart widget flutterflow, business intelligence chart custom widget, monthly trends bar chart flutterflow, performance analysis chart widget flutterflow